HISTORICAL COST EVOLUTION OF KEY RENEWABLE TECHNOLOGIES
Cost values of all technologies considered within the mix are essential input data to the objectives of the performed studies. As the main variables to be optimized are the newly installed power of a) Photovoltaic (PV) power plants, b) Wind power plants, and c) Concentrated Solar Power plants (CSP), the estimation of future cost values of these technologies are considered of special relevance. To this end, using historical IEA and IRENA documents and reports, the evolution of yearly average Levelized Cost of Electricity (LCOE) of utility-scale commercial projects, referenced against the total installed capacity (considered as the main driver to technology cost reduction), were analyzed. The results, from 1980 until 2019, are indicated in the following table, in 2019 USD.
| Year | PV | Wind | CSP | |||
|---|---|---|---|---|---|---|
| Capacity (GW) | Cost (c$/kWh) | Capacity (GW) | Cost (c$/kWh) | Capacity (GW) | Cost (c$/kWh) | |
| 1980 | 0.5 | 0.60 | ||||
| 1981 | 0.6 | 0.50 | ||||
| 1982 | 0.7 | 0.4 | ||||
| 1983 | 1.0 | 0.31 | ||||
| 1984 | 1.2 | 0.29 | 0.014 | n/a | ||
| 1985 | 1.5 | 0.27 | ||||
| 1986 | 1.7 | 0.25 | 0.074 | 0.51 | ||
| 1987 | 2.0 | 0.24 | ||||
| 1988 | 2.2 | 0.22 | 0.35 | n/a | ||
| 1989 | 2.5 | 0.21 | ||||
| 1990 | 0.006 | 1.15 | 3.0 | 0.20 | 0.35 | n/a |
| 1991 | 0.008 | 1.05 | 3.5 | 0.20 | ||
| 1992 | 0.01 | 0.98 | 4.0 | 0.19 | 0.35 | n/a |
| 1993 | 0.04 | 0.95 | 4.5 | 0.19 | ||
| 1994 | 0.07 | 0.90 | 5.0 | 0.19 | 0.35 | n/a |
| 1995 | 0.1 | 0.85 | 5.5 | 0.19 | ||
| 1996 | 0.3 | 0.8 | 6.1 | 0.18 | 0.35 | n/a |
| 1997 | 0.4 | 0.75 | 7.6 | 0.16 | ||
| 1998 | 0.5 | 0.70 | 10 | 0.14 | 0.35 | n/a |
| 1999 | 0.7 | 0.65 | 14 | 0.13 | ||
| 2000 | 1.5 | 0.60 | 17 | 0.13 | 0.35 | n/a |
| 2001 | 1.8 | 0.58 | 24 | 0.12 | ||
| 2002 | 2.3 | 0.54 | 31 | 0.12 | 0.35 | n/a |
| 2003 | 2.8 | 0.52 | 39 | 0.11 | ||
| 2004 | 3.7 | 0.50 | 48 | 0.11 | 0.35 | n/a |
| 2005 | 5.1 | 0.47 | 59 | 0.10 | ||
| 2006 | 7 | 0.44 | 74 | 0.10 | 0.37 | n/a |
| 2007 | 9 | 0.42 | 94 | 0.10 | ||
| 2008 | 16 | 0.40 | 121 | 0.09 | 0.48 | 0.40 |
| 2009 | 23 | 0.38 | 159 | 0.09 | 0.8 | 0.40 |
| 2010 | 40 | 0.32 | 198 | 0.09 | 1.1 | 0.35 |
| 2011 | 71 | 0.26 | 238 | 0.08 | 1.6 | 0.35 |
| 2012 | 101 | 0.22 | 283 | 0.08 | 1.6 | 0.35 |
| 2013 | 138 | 0.17 | 319 | 0.08 | 3.4 | 0.27 |
| 2014 | 178 | 0.14 | 370 | 0.08 | 4.3 | 0.24 |
| 2015 | 228 | 0.12 | 433 | 0.07 | 4.7 | 0.25 |
| 2016 | 306 | 0.11 | 487 | 0.07 | 4.8 | 0.28 |
| 2017 | 409 | 0.09 | 539 | 0.06 | 4.9 | 0.25 |
| 2018 | 512 | 0.08 | 591 | 0.06 | 5.6 | 0.19 |
| 2019 | 627 | 0.07 | 651 | 0.05 | 6.2 | 0.15 |
When these results are plotted, see figure below, interesting conclusions can be drawn. The photovoltaic and wind curves show very similar behaviour, with a rapid reduction in the initial cost until a certain inflexion point is reached around 10 GW of global deployment. At this point, it could be considered that both technologies reach their full commercial maturity.
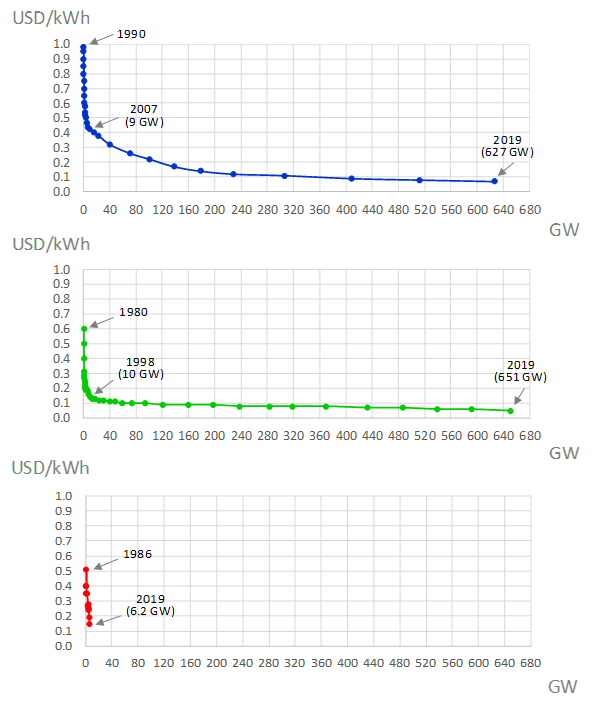
Being the current evolution of PV and Wind cost, and for a long time, nearly a straight line with a small slope, future cost evolution could be predicted with a reasonable degree of uncertainty. In the case of CSP, it becomes more difficult as the previous inflexion point has not been reached yet, as it is considered there is no reason to expect CSP to follow a different evolution (it should be noticed that both PV and Wind had equivalent or higher cost than CSP when these technologies achieved a similar level of global deployment). It must be reminded that CSP is a technology considered key in the decarbonization process, especially in sunny countries, and strongly complementary of PV and Wind, as it can provide renewable dispatchable baseload, thanks to their thermal energy storage capability, and also the minimum synchronous power generation required by the grid.